grafana
grafana is most commonly used for visualizing time series data for internet infrastructure and application analytics but many use it in other domains including industrial sensors, home automation, weather, and process control. the objective back then was to have this replace cacti entirely as that seems somewhat obsolete, although still a very good and functional tool.
jump straight to…
- installing grafana
- installing influxdb
- installing glances
- translating glances to influxdb
- installing grafana on synology
- synology stats
ssh commands required
majority of the ssh commands requires nano or vim. my choice of a terminal editor would be nano. to find out more how to use nano, visit the following page to get the basics.
look out for notes
notes are placed in the guides, these markers requires your attention.
- 🗣 note: comments which you should take note of.
- ⚠️ important: comments which are important.
report inaccuracies and errors
if something in this guide is inaccurate, wrong, or outdated, report it by scanning the qr code.
👨🏻💻 [installing grafana]
launch terminal.app.
key in the following syntax:
brew install grafanato have it started automatically start, just type:
brew services start grafanato access grafana, open up a browser and key in, set it up (e.g. admin details):
http://macOS-ip:3000
🗣 note: the default username and password are admin/admin
👨🏻💻 [installing influxdb]
🗣 note:: influxdb will be the time database that will store all the information from glances, which will be handed over to grafana for the output.
launch terminal.app.
key in the following syntax:
brew install influxdbstart up the service:
brew services start influxdbyou will need to create a database, titled grafana to do so, open up a terminal window and key in the syntax, in sequence:
 influx
 CREATE DATABASE glances
to check if you have it created, type:
show databasesif it shows up as the following, you can ctrl+c to exit from influxdb:
 > SHOW DATABASES
 name: databases
 ---------------
 name
 _internal
 glances

 >
👨🏻💻 [installing glances]
🗣 note:: glances will be the tool that will be indexing your mini and grabbing the data and the other backend work for grafana.
launch terminal app, enter the following, in sequence:
 brew install python
 pip install glances
once it is all setup, copy and paste the following this will install all the dependencies:
pip install bottle requests zeroconf netifaces influxdb elasticsearch potsdb statsd pystache pysnmp pika py-cpuinfo bernhard cassandra scandironce installed, to check that it works, type the following:
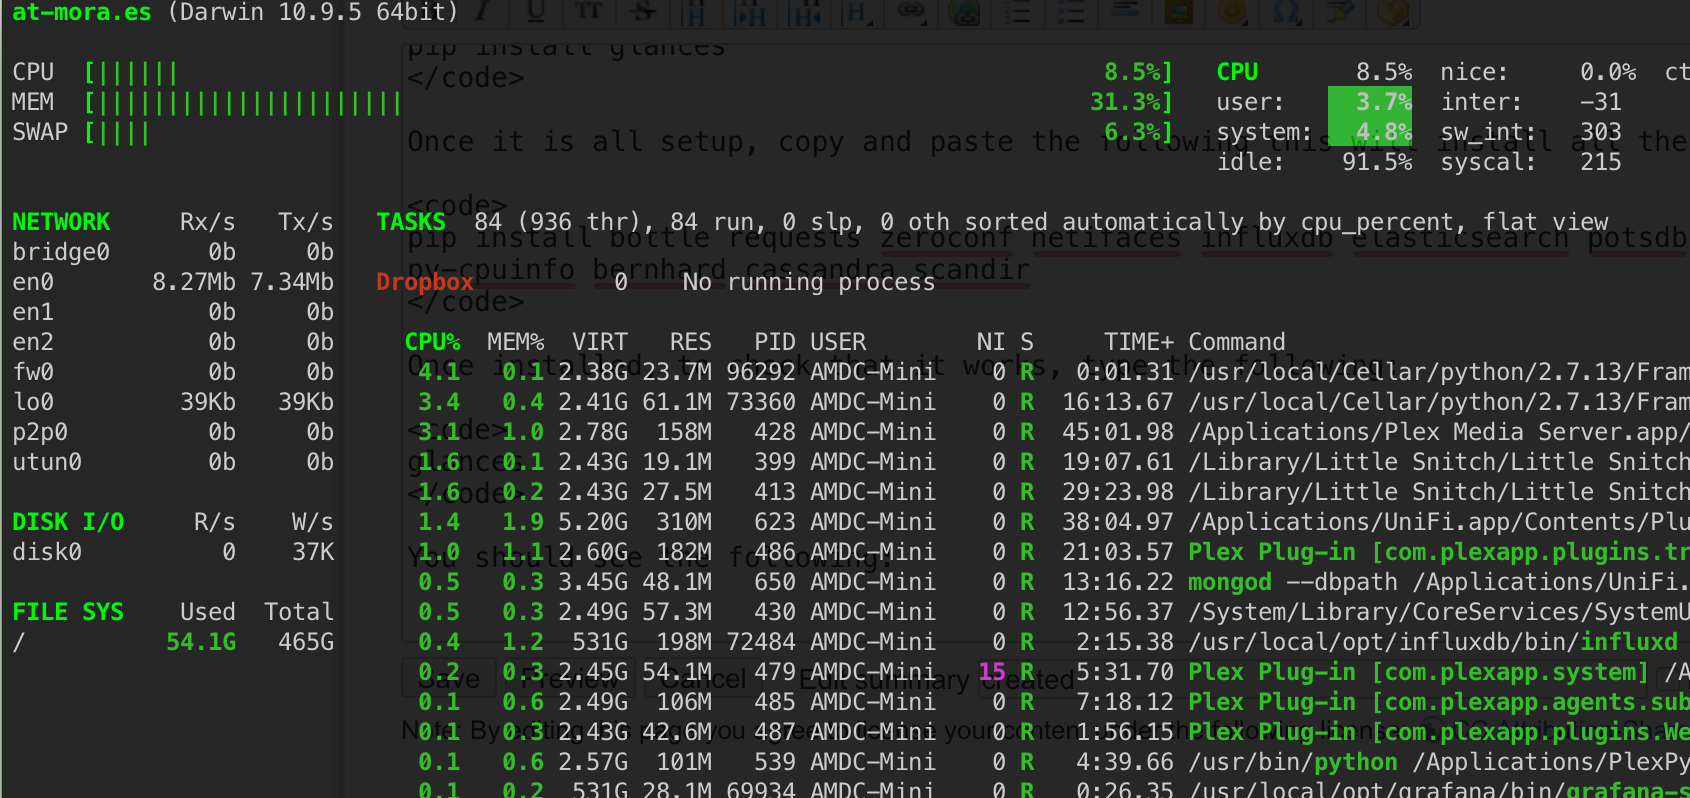
glancesyou will see the following output:

👨🏻💻 [translating glances > influxdb]
to have glances throw the information into grafana there’s couple of things to do. make sure that you already have your grafana setup.
in your grafana, create a datasource. navigate to data sources
click on +add data source
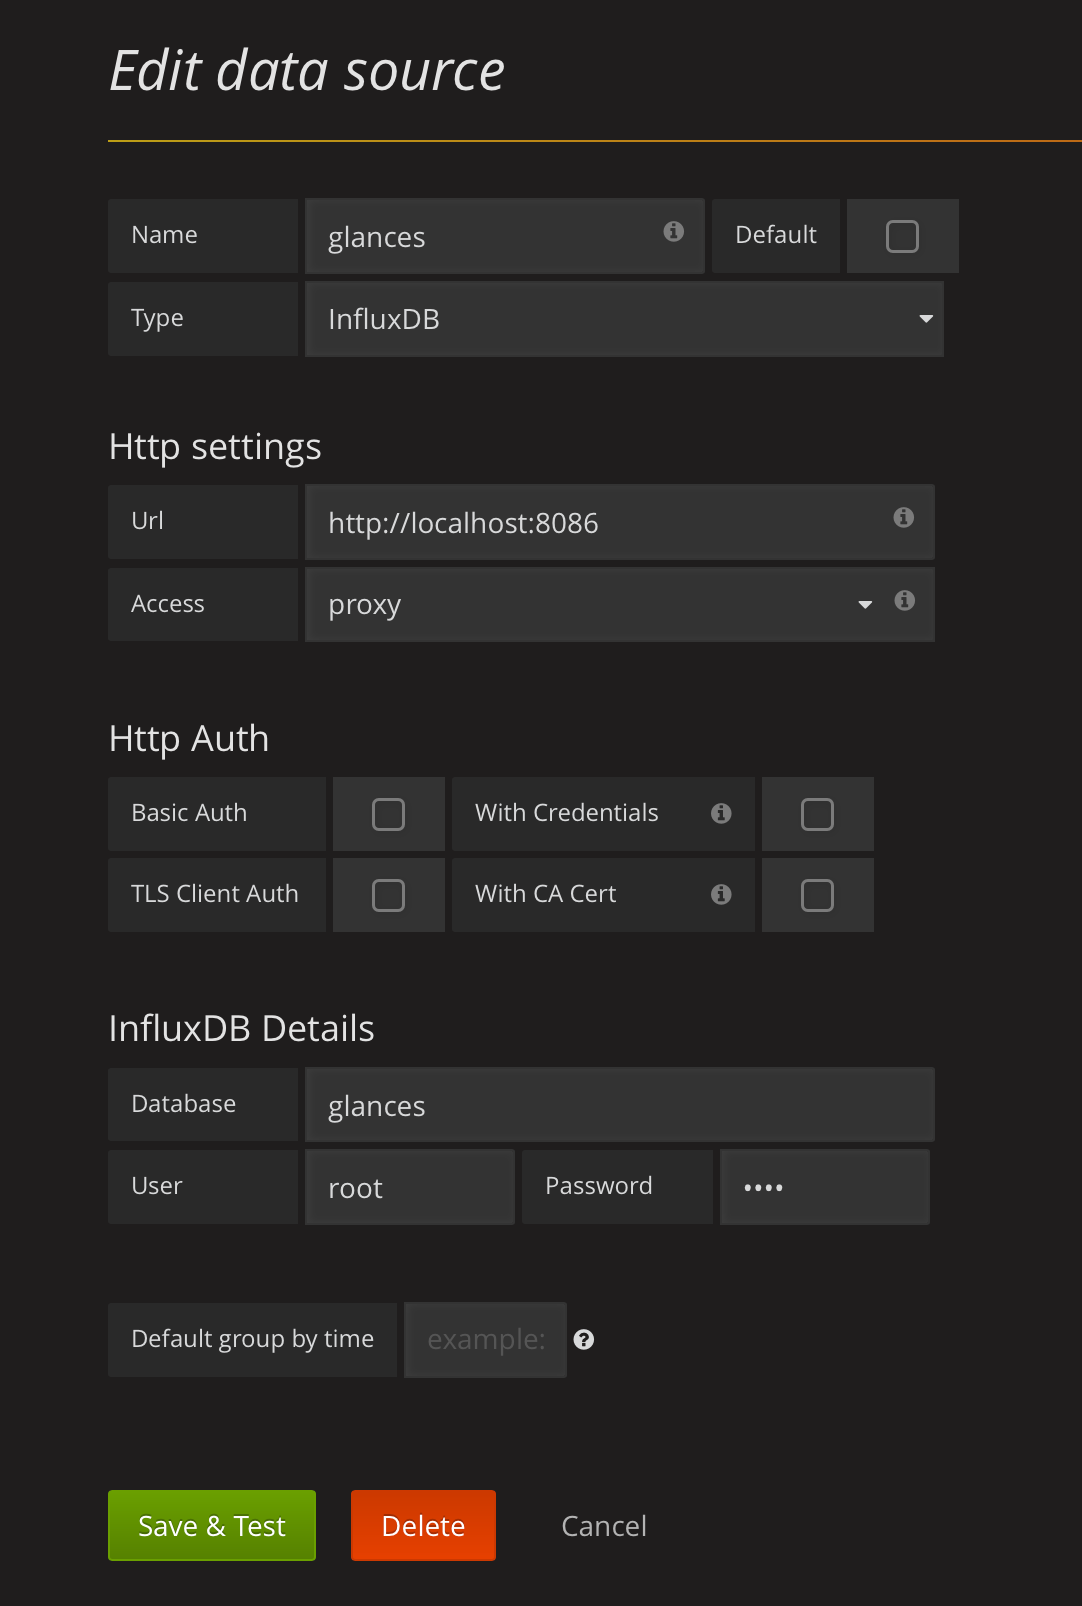
create the datasource as follows:
- Name: namewhatyouwant
- Type: InfluxDB
- Url: http://localhost:8086
- Access: proxy
- InfluxDB database: glances
- User: root
- Password: root

- now import the glances-grafana.json file into your grafana’s dashboard.
- click on the Sun logo
- click on dashboards > import
now back to complete the setup
open up a terminal window:
nano /usr/local/share/doc/glances/glances.confsearch for influxdb, use ctrl+w in nano to do so.
amend it to look as such:
 [influxdb]
 # Configuration for the --export-influxdb option
 # https://influxdb.com/
 host=localhost
 port=8086
 user=root
 password=root
 db=glances
 prefix=localhost
 #tags=foo:bar,spam:eggs
save the file.
next, you will need to create a directory and copy the config file over.
sudo mkdir /usr/local/etc/glances

sudo cp /usr/local/share/doc/glances/glances.conf /usr/local/etc/glances/glances.conf
install one last dependency:
pip install influxdbnow, on your macOS, launch terminal.app. key in the following:
glances -q --export-influxdb
- 🗣 note: use screen to have this run in the background.
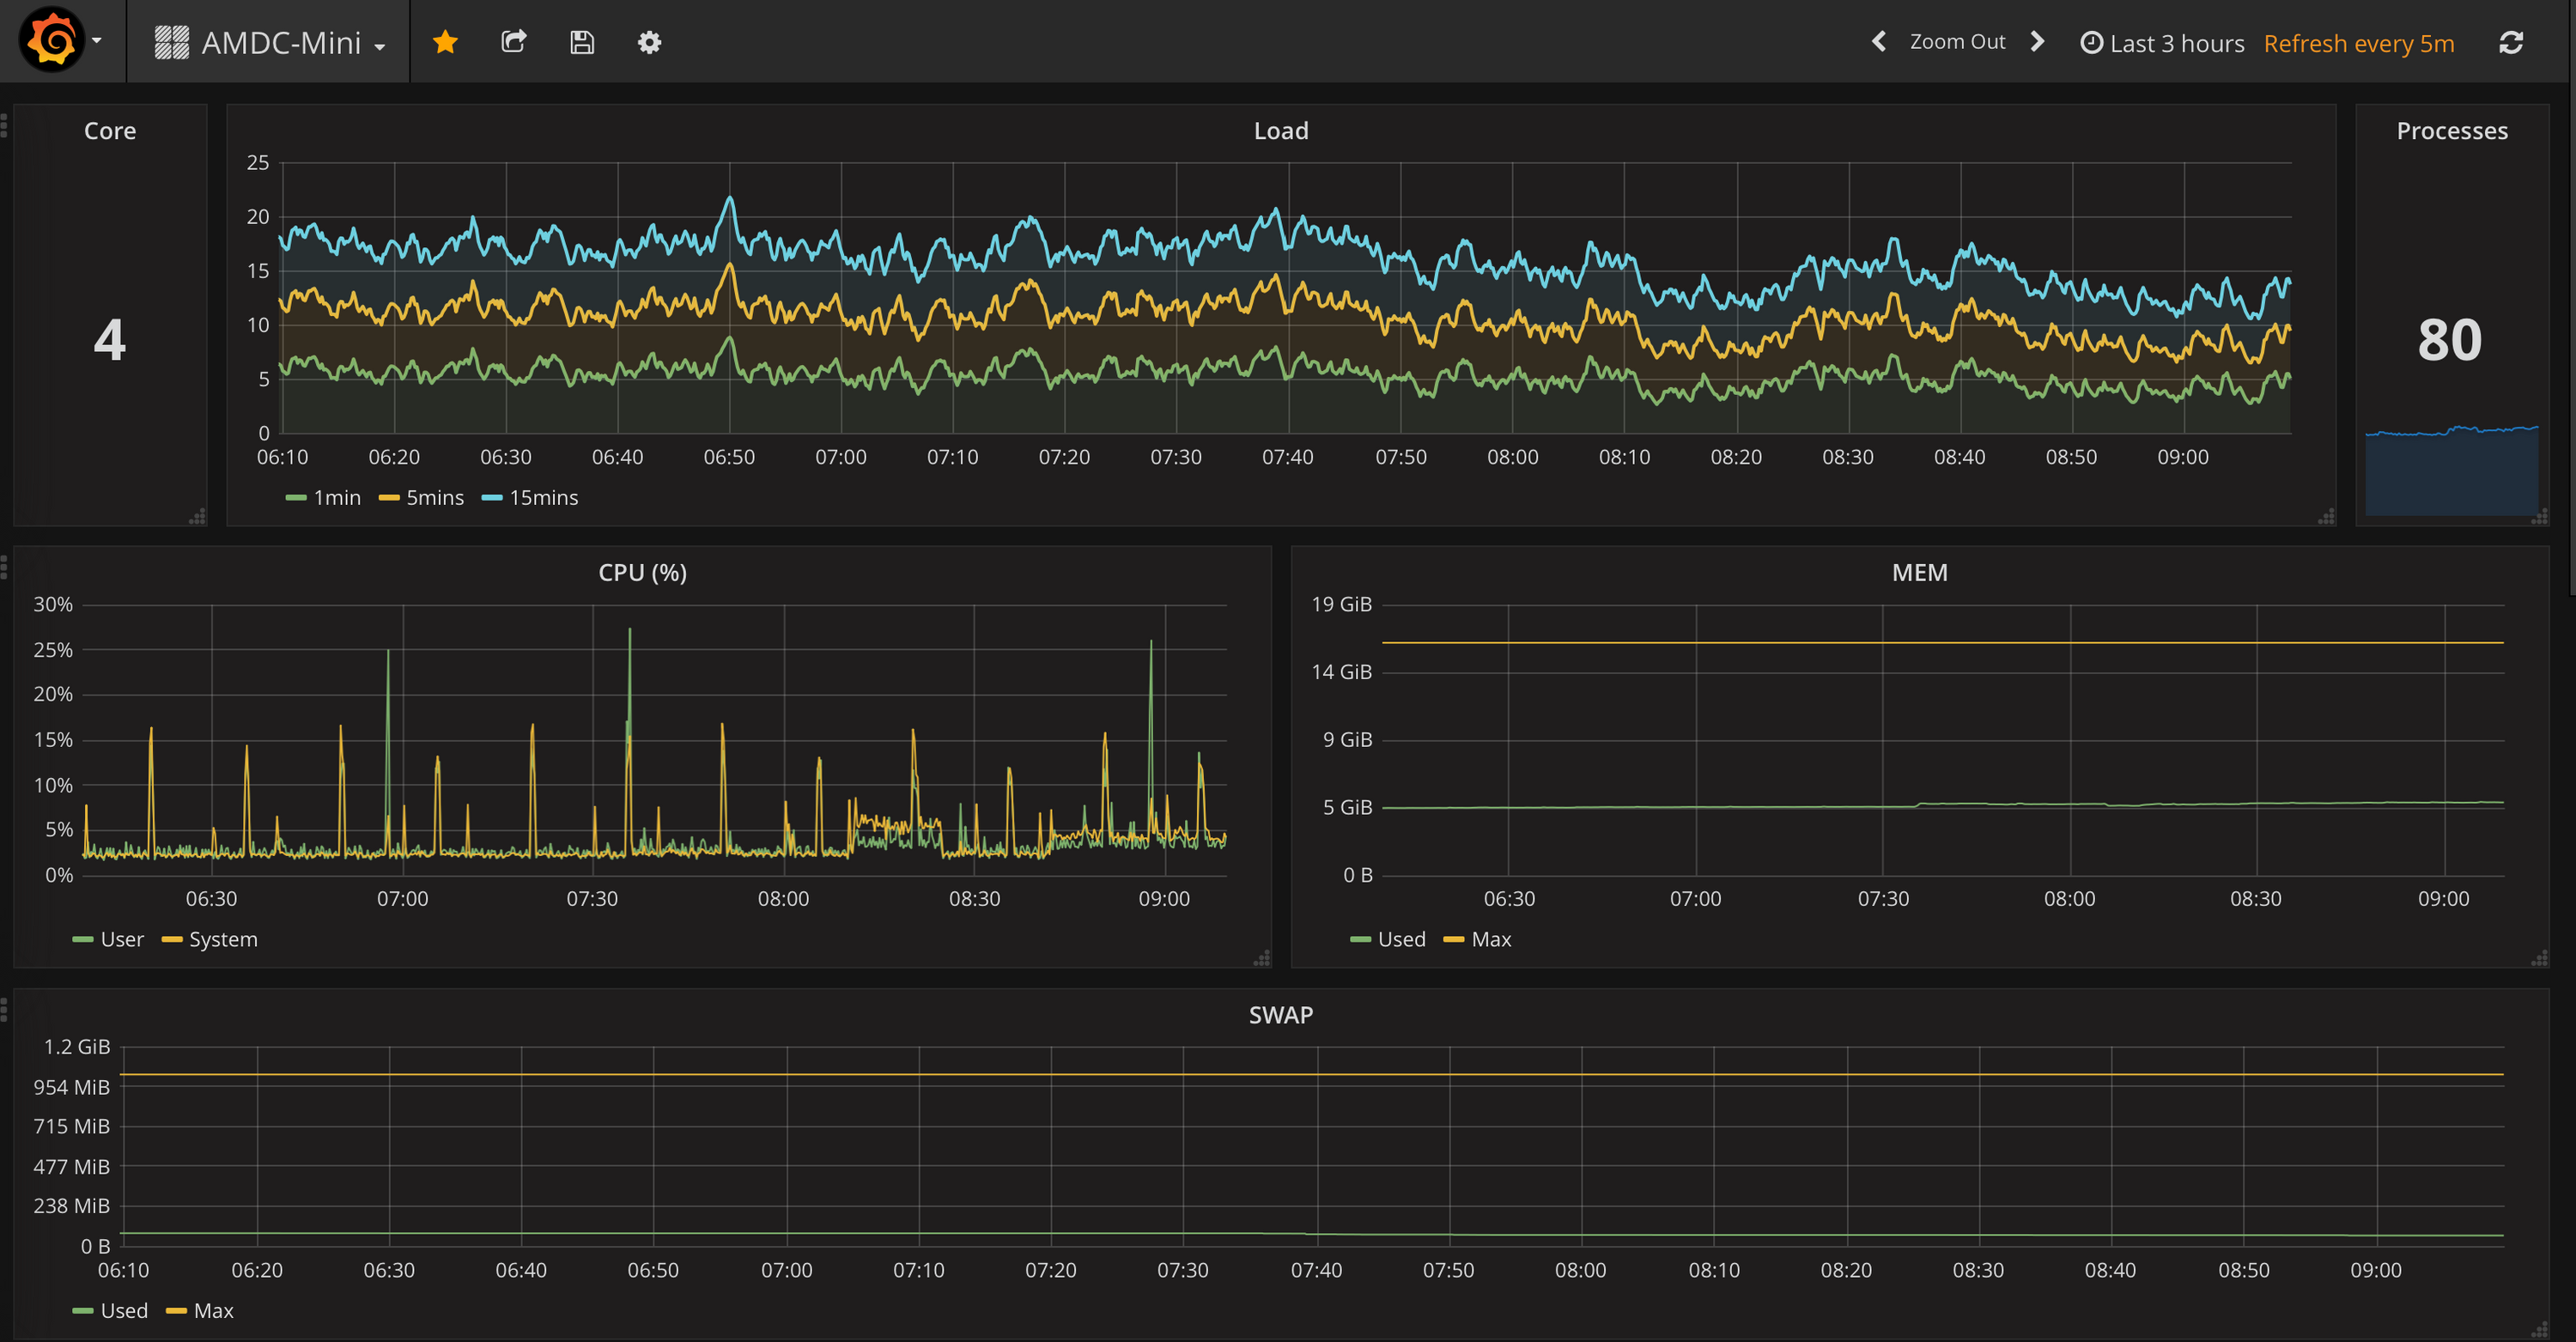
- head over to your grafana’s site and for that dashboard you had imported, it should start punching data in.

👨🏻💻 [installing grafana on synology]
i have successfully migrated cacti into grafana. to do so, there are a number of things that you will be required to perform. i will break things down in details but if you do hit any snags, let me know and I’ll try to recall the steps taken. to begin, please see the pre-requisites:
upgrade DSM to the latest firmware
- install python (from synology package center)
- install python
- install glances
- install influxdb
install python package from the package center in dsm.
install pip, ssh into your synology box and key in the following after gaining root access:
 cd /volume1/downloads
 wget https://bootstrap.pypa.io/get-pip.py
after downloading is complete, run the following syntax:
python get-pip.pyinstall glances
- 🗣 note: the latest version seems to be a bit screwy, so stick to 2.7.1.
still in your synology ssh, key in the following syntax:
pip install glances==2.7.1install all other dependencies:
pip install bottle requests zeroconf netifaces influxdb elasticsearch potsdb statsd pystache pysnmp pika py-cpuinfo bernhard cassandra scandiredit the glances.conf file:
nano /usr/local/share/doc/glances/glances.confsearch for influxdb, use ctrl+w in nano to do so.
amend it as follows:
 <code>
 [influxdb]
 # Configuration for the --export-influxdb option
 # https://influxdb.com/
 host=** IPADDRESS OF YOUR MINI SERVER **
 port=8086
 user=root
 password=root
 db=glancesnas
 prefix=**IPADDRESS OF YOUR SYNOBOX**
 #tags=foo:bar,spam:eggs
 </code>
save the file and exit.
next, you will need to create a directory and copy the config file over.
sudo mkdir /usr/local/etc/glances

sudo cp /usr/local/share/doc/glances/glances.conf /usr/local/etc/glances/glances.conf
after installing, perform a glances command in the synology prompt, if installed correctly, you will be able to see the glances page.
in your synology ssh:
pip install influxdbyou will not need to configure it like what you did for the macOS.
creating the datasource and databases.**
- ⚠️ important: you will need to create the databases and datasource in your grafana in order for your synology to feed the information into your influxdb
for my setup, i created the following databases in influxdb glancesnas and synobox. you can choose something else if you wish but ensure that the datasources created in grafana and the files are amended accordingly.
ssh into your macOS server and perform the following:
influx
create database glancesnas
create database synobox
exit
once you have python, pip, glances and influxdb installed and configured on your synology box, it is time to give it a test run.
export the dashboard from your current grafana installation on your macOS server.
import the dashboard into your grafana installion on your synology box.
- 🗣 note: after importing it in, it is now time to test if your Synology is able to export the data out. Please do note that for the ‘’glances –export…’’ command, what I did was the following:
- screens into my Mini Server
- opened up a terminal window
- ssh into Synology box with root access
key in the following command:
glances -q –export-influxdb –config /usr/local/etc/glances/glances.conf
- ⚠️ important: you will need to indicate the config file location for synology, it somehow points the path to /usr/local/bin/glances which is incorrect glances in the bin folder is an execution file and not a folder
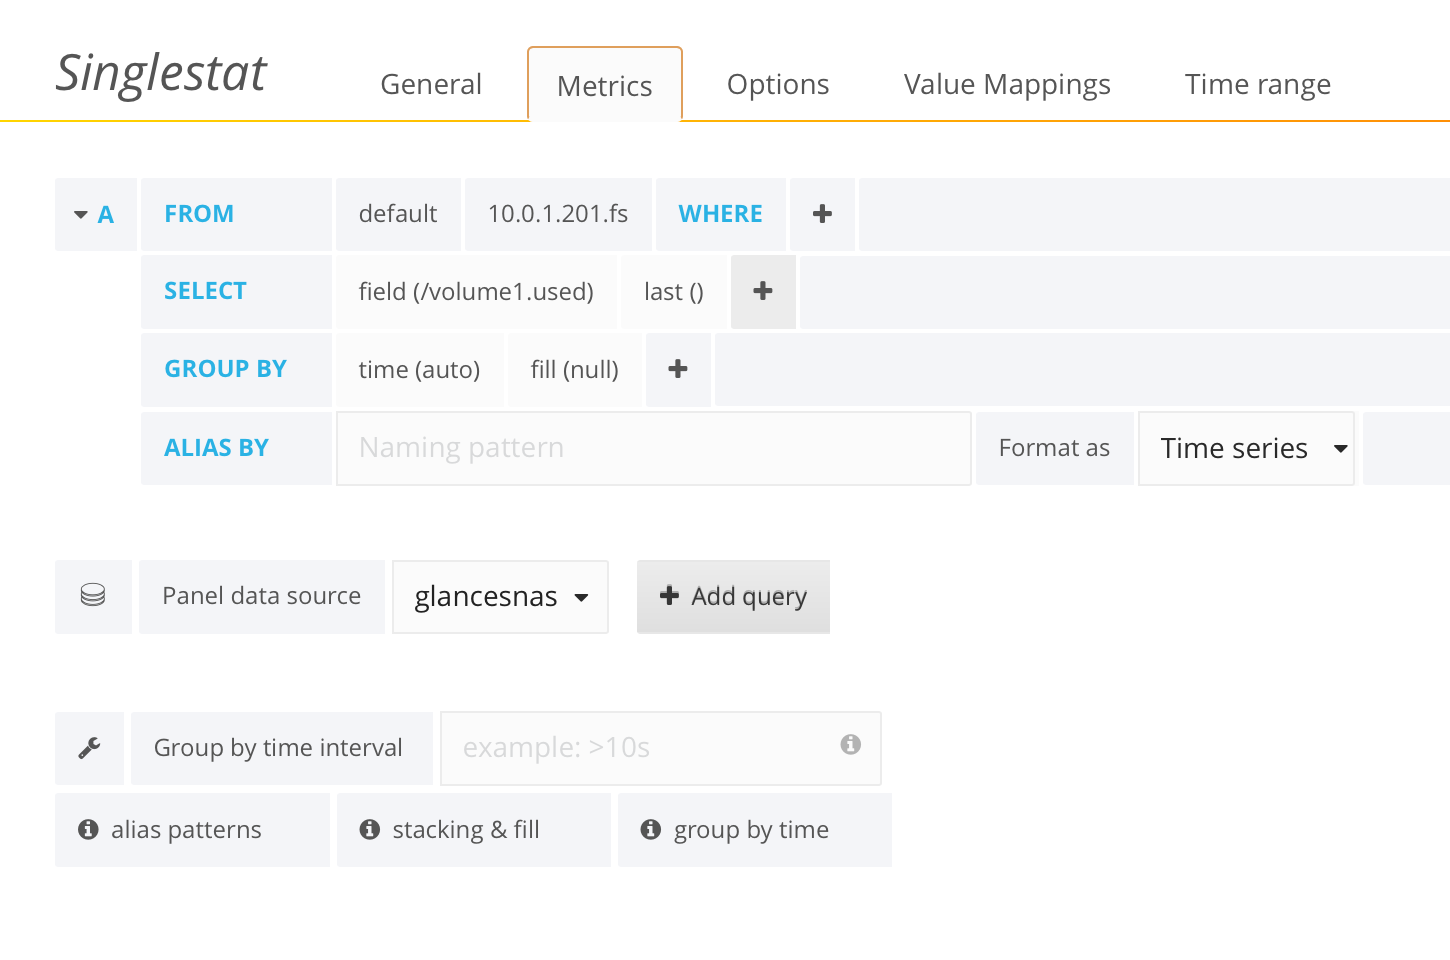
- head back to your grafana console and open up the imported .json file. edit any of the graph and if you had done the steps above correctly, you will see the following:

<h1 id="synologystats> 👨🏻💻 [synology stats in grafana]
this took me a while to get it right but i finally did manage to do so. if you had followed the steps above, (e.g. creation of influxdb and datasource synobox, all you will need to do is to copy and create the .sh file.
create a working directory in your synology. i created mine in:
/volume1/web/grafanacopy the following script and save it as synologystats.sh:
- ⚠️ important: remember to change the ip to your synology’s ip
    #!/bin/bash

    #This script pulls storage information from the Synology NAS

    #The time we are going to sleep between readings
    #Also used to calculate the current usage on the interface
    #30 seconds seems to be ideal, any more frequent and the data
    #gets really spikey.  Since we are calculating on total octets
    #you will never loose data by setting this to a larger value.
    sleeptime=30


    get_drive_temps () {
        counter=0
        numdrives=4
        while [  $counter -lt $numdrives ]; do

            #Get Drive Name
            syno_drivename=`snmpwalk -v 2c -c public IPADDRESSOFYOURNAS 1.3.6.1.4.1.6574.2.1.1.2.$counter -Ov | cut -c 10-`
            syno_drivename=${syno_drivename::-1}
            syno_drivename=${syno_drivename// /_}

            #Get Health Status
            syno_healthstatus=`snmpwalk -v 2c -c public IPADDRESSOFYOURNAS 1.3.6.1.4.1.6574.2.1.1.5.$counter -Ov | cut -c 10-`

            #Get Health Status
            syno_drivetemps=`snmpwalk -v 2c -c public IPADDRESSOFYOURNAS 1.3.6.1.4.1.6574.2.1.1.6.$counter -Ov | cut -c 10-`

            echo "Drive Name: $syno_drivename"
            echo "Health Status: $syno_healthstatus"
            echo "Drive Temps: $syno_drivetemps"

            # write to database here
            curl -i -XPOST 'http://IPADDRESSOFYOURMINI:8086/write?db=synobox' --data-binary "storage_data,host=synology,diskname=$syno_drivename disktemperature=$syno_drivetemps"
            curl -i -XPOST 'http://IPADDRESSOFYOURMINI:8086/write?db=synobox' --data-binary "storage_data,host=synology,diskname=$syno_drivename diskstatus=$syno_healthstatus"

            let counter=counter+1
            done
        }

    get_syno_temp () {
        COUNTER=0
        while [  $COUNTER -lt 4 ]; do
            #-- Synology NAS --
            #DS Temp
            syno_temperature=`snmpwalk -v 2c -c public IPADDRESSOFYOURNAS 1.3.6.1.4.1.6574.1.2 -Ov | cut -c 10-`

            echo "Synology Temperature: $syno_temperature"


            curl -i -XPOST 'http://IPADDRESSOFYOUMINI:8086/write?db=synobox' --data-binary "syno_temperature,host=synology,temperature=Synology_Temperature value=$syno_temperature"

            let COUNTER=COUNTER+1

        done
    }


    #Prepare to start the loop and warn the user
    echo "Press [CTRL+C] to stop..."
    while :
        do
            get_drive_temps
            get_syno_temp

            if [[ $syno_volblocksize -le 0 || $syno_volcapacity -le 0 || $syno_volused -le 0 ]];
    then
            echo "Skip this datapoint - something went wrong with the read"
    else
            #Output console data for future reference
            print_data
            write_data
    fi

        if [[ $syno_temp -le 0 ]];
            then
            echo "Skip this datapoint - something went wrong with the read"
    else
            #Output console data for future reference
            print_data
            write_data
    fi

        #Sleep between readings
        sleep "$sleeptime"

    done
upload the file into /volume1/web/grafana
ssh into your synology box with root access and type the following syntax:
 cd /volume1/web/grafana
 chmod a+x synologystats.sh
 ./synologystats.sh
- 🗣 note: if configured correctly, you shouldn’t have any errors and check grafana and see if the other missing graphs work.
if all goes well, you can let it execute through your macOS
launch a terminal.app on your macOS
from your macOS terminal, run a ssh -l command to ssh into your synology box.
execute the following syntax:
 cd /volume1/web/grafana/

 ./synologystats.sh
- 🗣 note: use screen to have this run in the background.