telegraf

telegraf can help monitor your devices which pumps the metrics into influxdb. this guide is to help install telegraf via docker and to then display your metrics through grafana.
jump straight to…
- preparing for telegraf
- installing docker-telegraf
- telegraf.conf and mib files
- updating sources for docker-telegraf
- creating telegraf datasource
- new grafana panels
ssh commands required
majority of the ssh commands requires nano or vim. my choice of a terminal editor would be nano. to find out more how to use nano, visit the following page to get the basics. i had this installed on my macOS server.
look out for notes
notes are placed in the guides, these markers requires your attention.
- 🗣 note: comments which you should take note of.
- ⚠️ important: comments which are important.
report inaccuracies and errors
if something in this guide is inaccurate, wrong, or outdated, report it by scanning the qr code.
⚡ [pre-requisites]
- docker required
- influxdb installed and configured
👨🏻💻 [preparing for telegraf]
assuming that you already have influxdb configured and create the database for telegraf to utilise. if not, create a new database named telegraf.
ssh into your mac and type:
 influx
 create database telegraf
or if you’re using the synology influxdb:
 docker exec -it influxdb bash
 influx
 create database telegraf
create some new folders (on synology):
mkdir /volume1/docker/telegraf && cd /volume1/docker/telegraf && mkdir config mibsif you are on a mac, you can also create and map folders:
mkdir ~/opt/docker/telegraf && cd ~/opt/docker/telegraf && mkdir config mibs
👨🏻💻 [getting docker-telegraf installed]
ssh into your synology and type the following in sequence:
 docker run \
  -d --name=telegraf \
 --restart always \
 -v /volume1/docker/telegraf/config/telegraf.conf:/etc/telegraf/telegraf.conf:ro \
 -v /volume1/docker/telegraf/mibs:/usr/share/snmp/mibs \
 -v /var/run/docker.sock:/var/run/docker.sock:ro \
 -e "HOST_PROC=/host/proc" \
 -e "HOST_SYS=/host/sys" \
 -e "HOST_ETC=/host/etc" \
 -v /sys:/host/sys:ro \
 -v /proc:/host/proc:ro \
 -v /etc:/host/etc:ro \
 --net=host \
 --pid=host \
 -p 8092:8092 -p 8094:8094 -p 8125:8125 \
  telegraf
hit enter and your docker will be up and running.
👨🏻💻 [telegraf.conf and mib files]
you will need to get telegraf to read your configurations. take a look at this sample which is for the synology system. you can download and save it as telegraf.conf and you must have this uploaded into the /config directory which you had created locally earlier.
 **on your synology**
 /volume1/docker/telegraf/config

 **on your mac**
 ~/opt/docker/telegraf/config
💽 download: telegraf.conf
next, download the synology mibs files and save them into your local directory.
 **on your synology**
 /volume1/docker/telegraf/mibs

 **on your mac**
 ~/opt/docker/telegraf/mibs
💽 download: synology mibs 🗣 note: do a search for keyword download within the pdf file
👨🏻💻 [installing snmp-mibs-downloader]
login to your docker-telegraf:
docker exec -it telegraf bashupdate the current packages:
apt-get updateinstall nano:
apt-get install nanotelegraf somehow requires snmp-mibs-downloader module. the updating of the conatiner’s datasource will help do away with the inputs.snmp plugin errors that you may encounter. edit your sources.list.
nano /etc/apt/sources.listadd the following:
 deb http://deb.debian.org/debian stretch main contrib non-free
 deb-src http://deb.debian.org/debian stretch main contrib non-free

 deb http://security.debian.org/debian-security/ stretch/updates main contrib non-free
 deb-src http://security.debian.org/debian-security/ stretch/updates main contrib non-free

 deb http://deb.debian.org/debian stretch-updates main contrib non-free
 deb-src http://deb.debian.org/debian stretch-updates main contrib non-free
save the file and update the sources:
apt-get updateinstall snmp-mibs-downloader:
apt-get install snmp-mibs-downloaderexit the docker-telegraf bash and restart your docker-telegraf container:
docker restart telegraftail the docker-telegraf container to check for any errors:
docker logs -f telegraf
👨🏻💻 [creating a datasource in grafana]
login to grafana
create an influxdb datasource:
 name: telegraf
 url: http://ip:8086
 database: telegraf
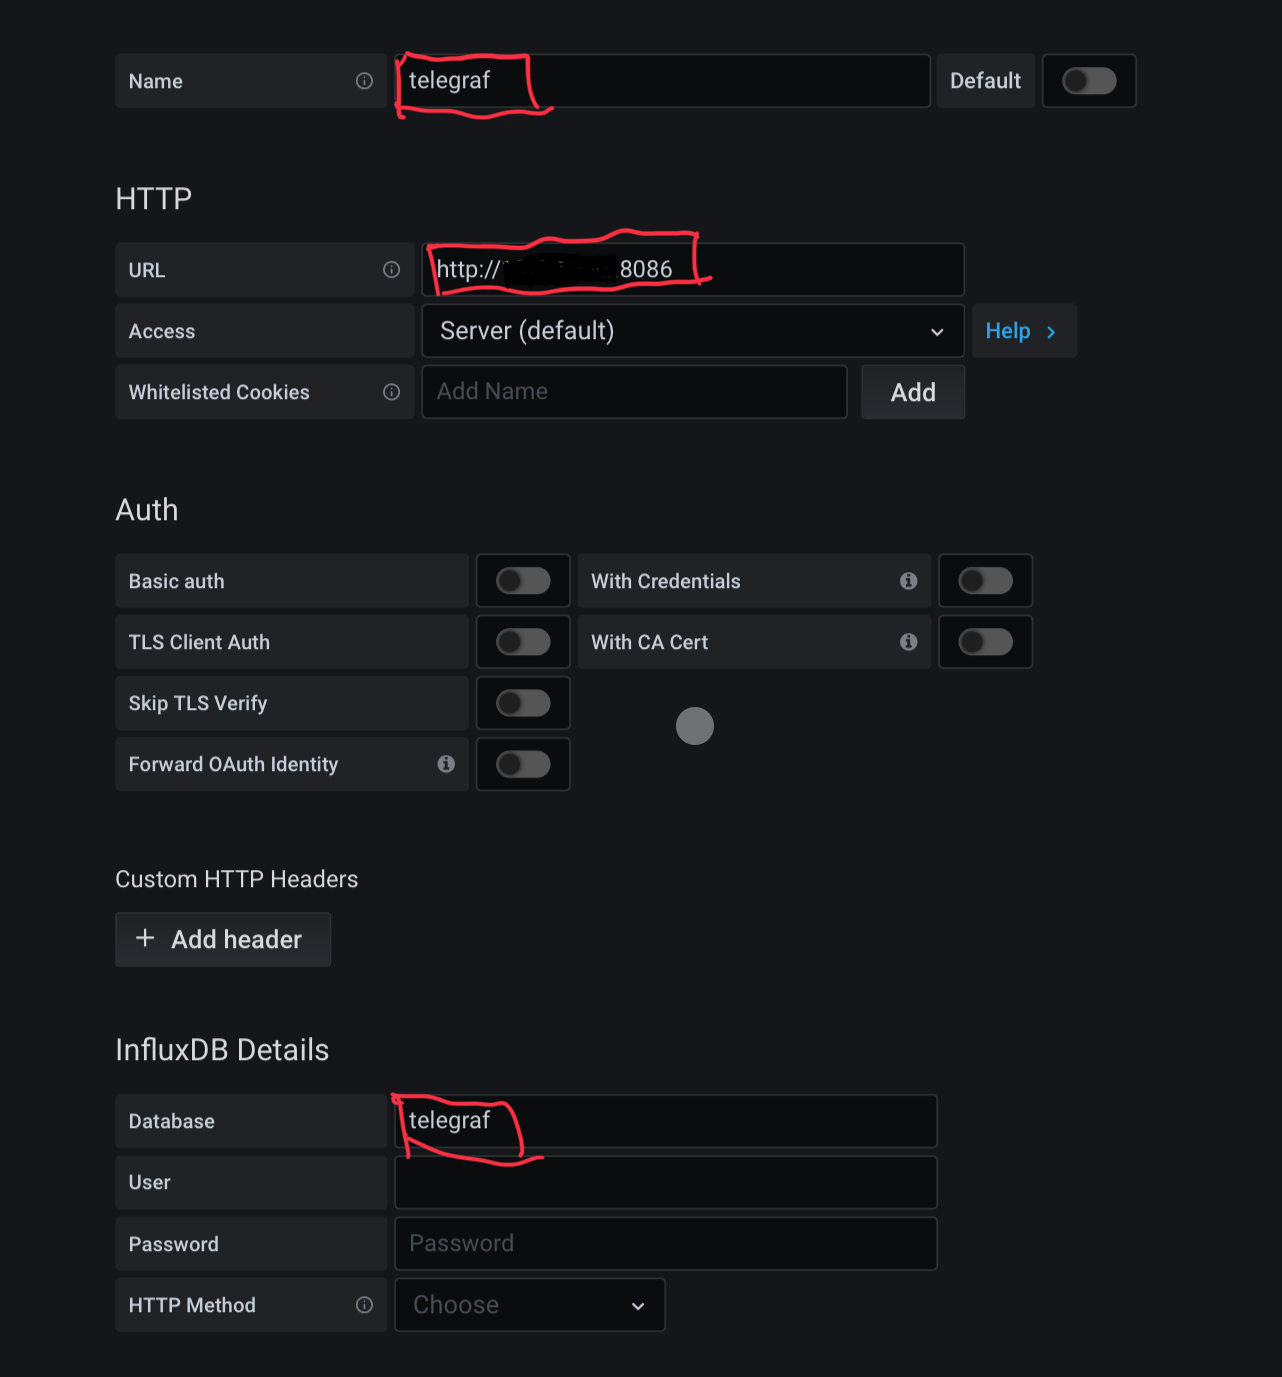
- save and test
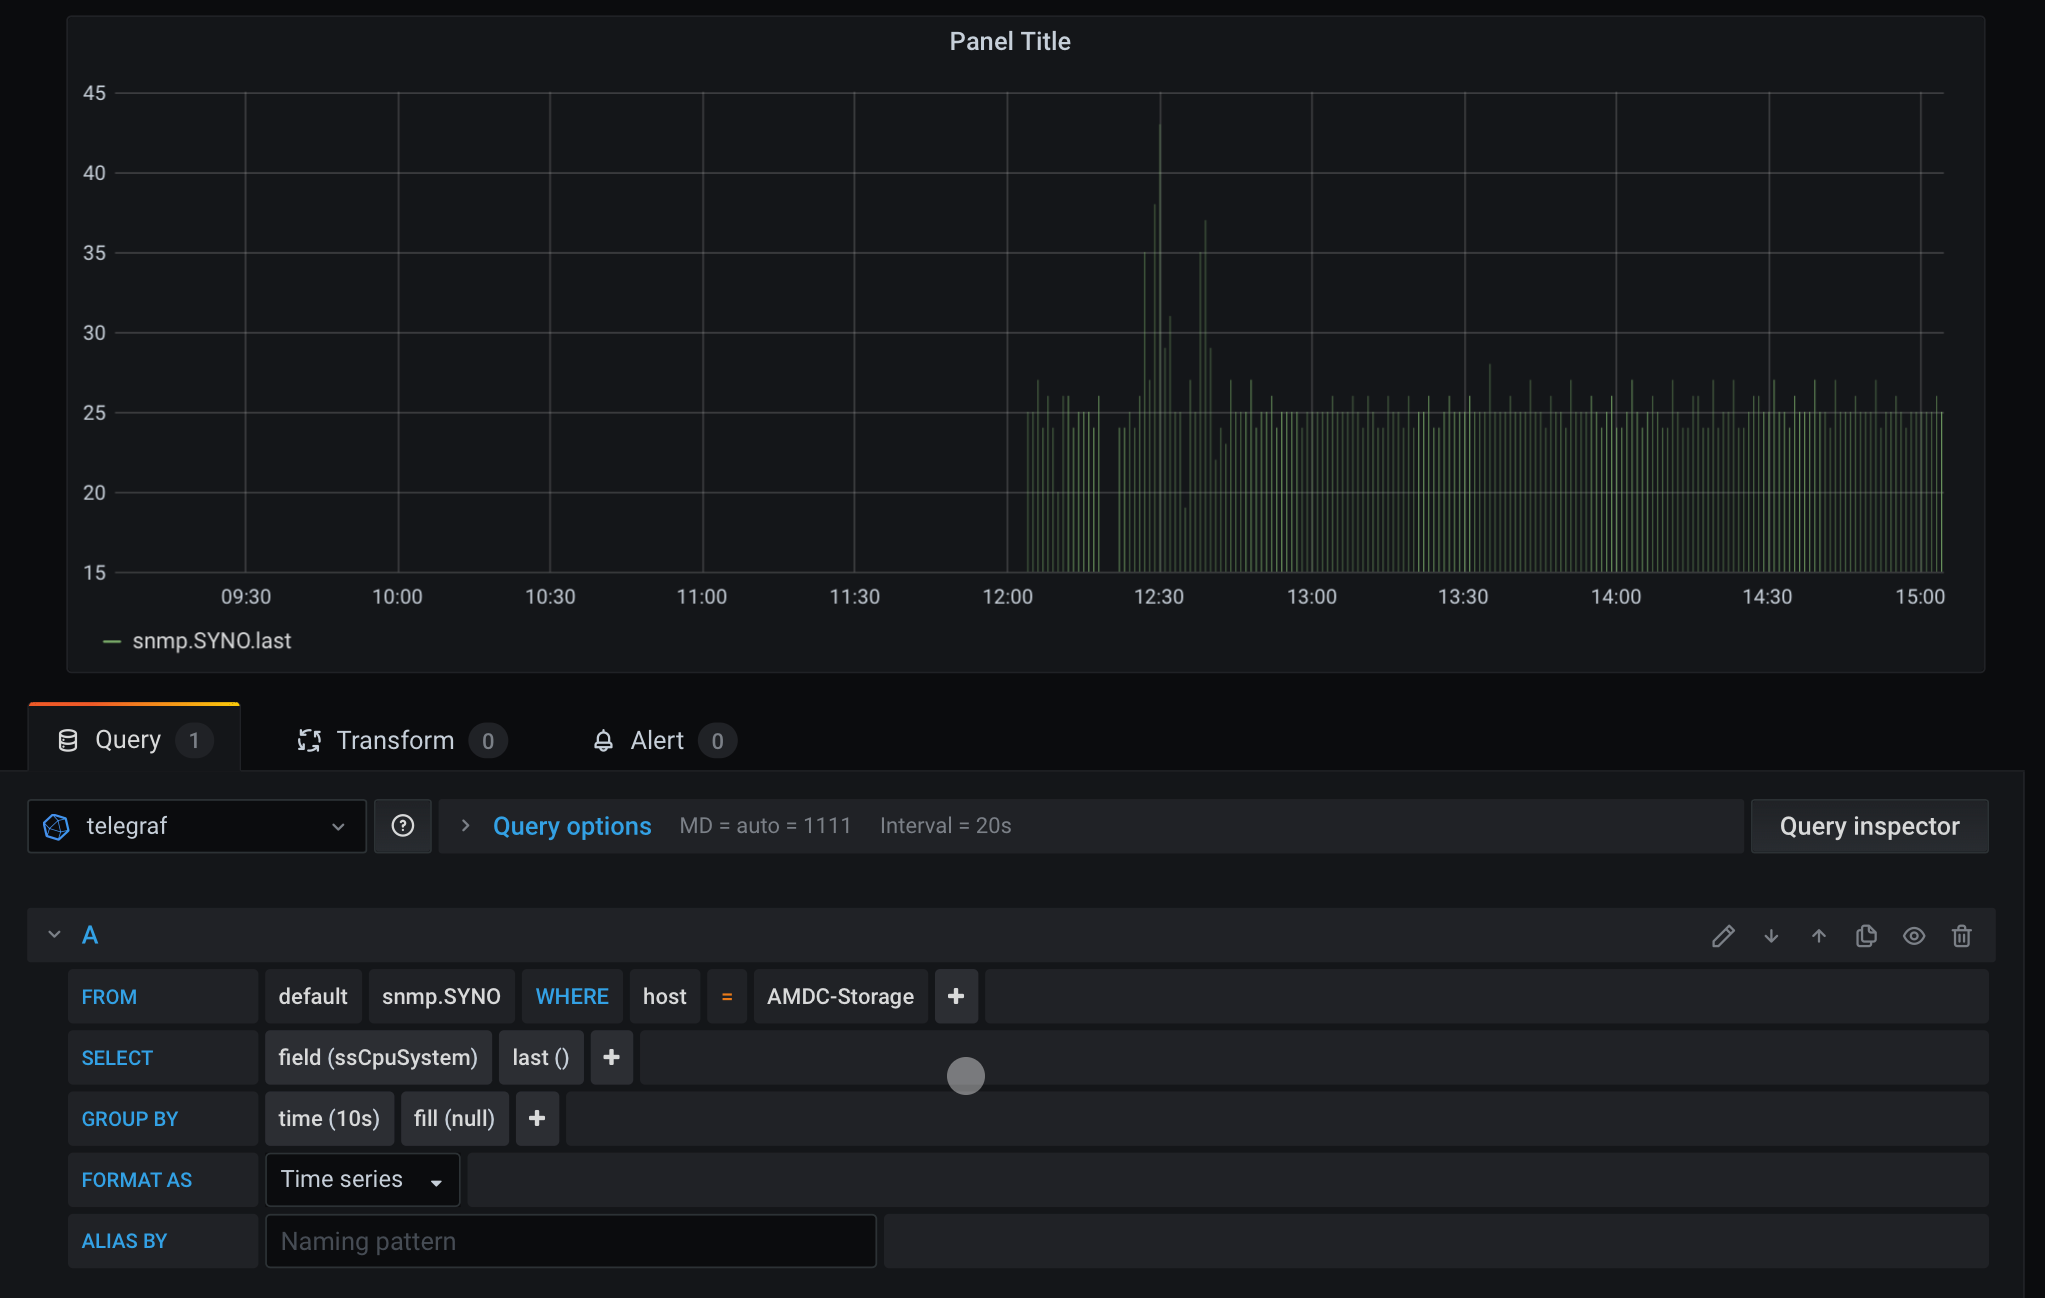
👨🏻💻 [creating new panels in grafana]
login to you grafana and try creating new panels.
as a sample: