unified dashboard
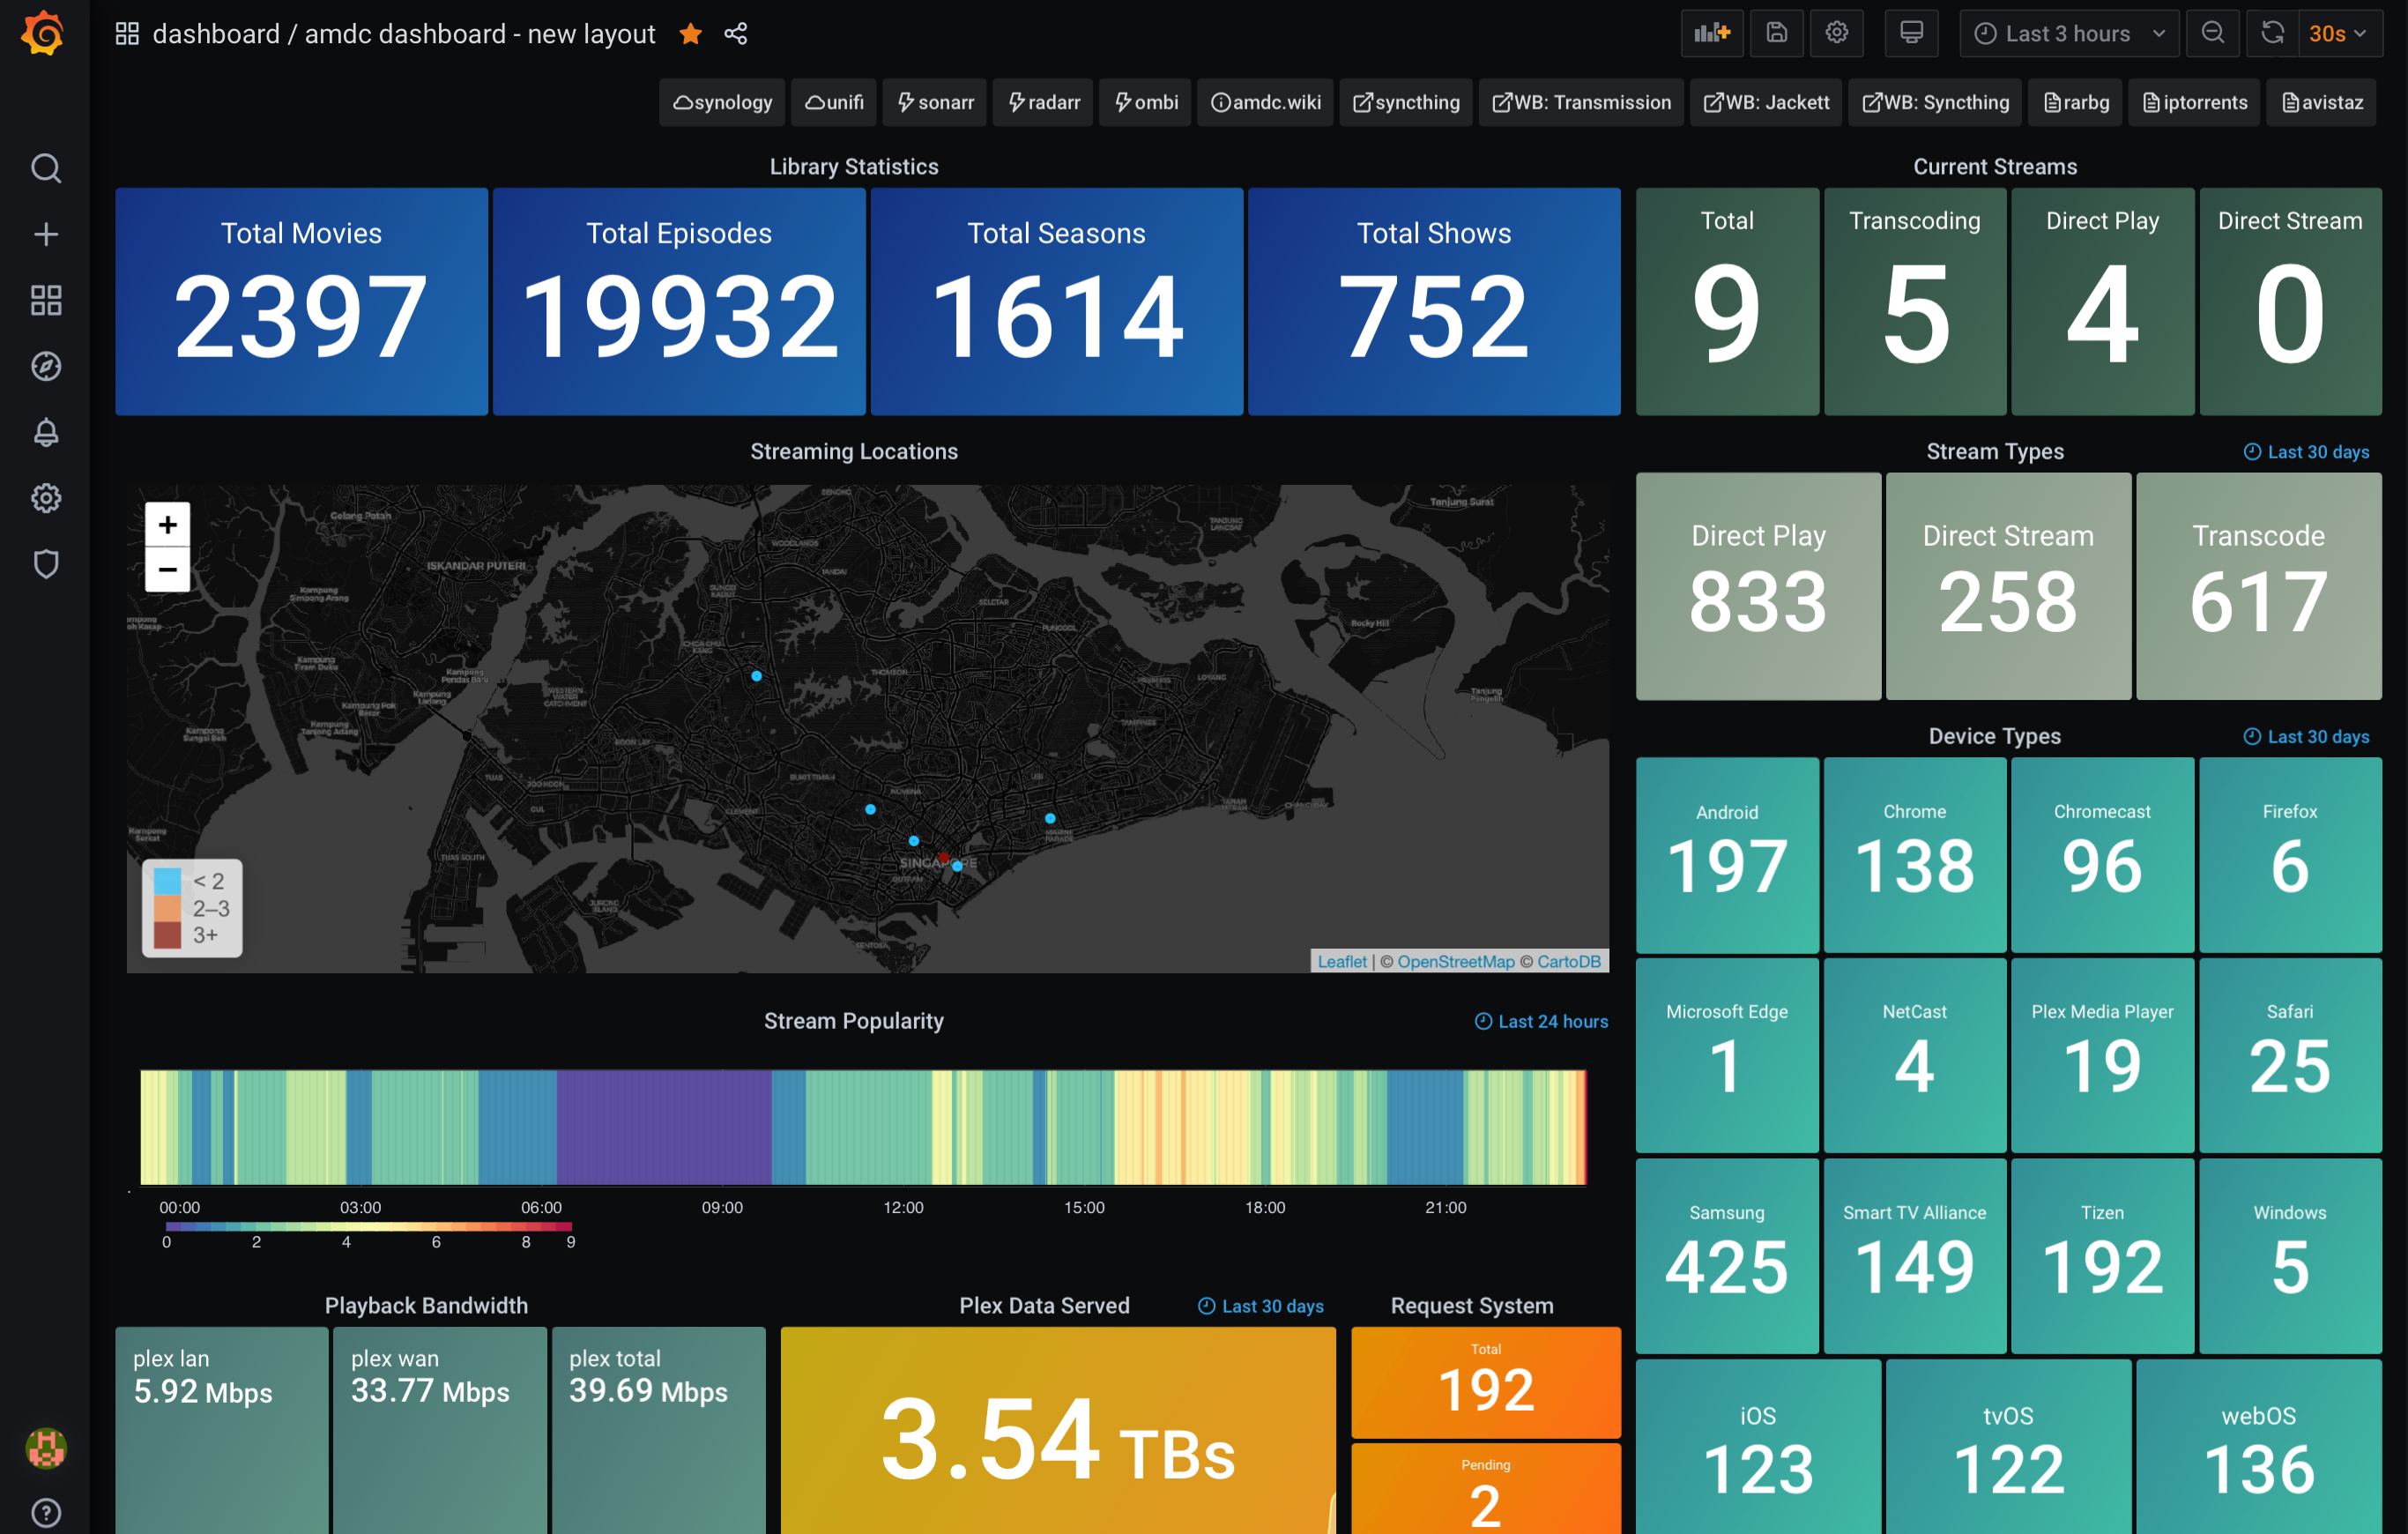 this guide will provide you with information on how to have a unified dashboard using grafana. the items which are unified are as follows:
- unifi system stats
- synology stats
- macOS stats
- varken stats
the base of this dashboard uses varken’s dashboard which has been heavily modified to suit my own needs and requirements. you will need to first install the following items before you begin.
- grafana/varken/influxdb on your synology. (guide available under the varken section)
- netdata on your synology, macOS server. (guide available under the netdata section)
- separate influxdb on your macOS. (using brew) (guide available under the grafana section)
- unifi-poller dashboard. (guide available under the unifi section)
- configure synologystats.sh script. (guide available under the grafana section)
- screen for macOS (using brew - brew install screen) to have synologystats.sh script run in the background.
jump straight to…
- setting opentsdb up
- piping netdata to influxdb
- setting up opentsdb source in grafana
- stats for synology
- setting up synology source in grafana
- setting up new panels in grafana
ssh commands required
majority of the ssh commands requires nano or vim. my choice of a terminal editor would be nano. to find out more how to use nano, visit the following page to get the basics. i had this installed on my macOS server.
look out for notes
notes are placed in the guides, these markers requires your attention.
- 🗣 note: comments which you should take note of.
- ⚠️ important: comments which are important.
report inaccuracies and errors
if something in this guide is inaccurate, wrong, or outdated, report it by scanning the qr code.
⚡ [pre-requisites]
this guide assumes that you have already installed the following into your systems:
- netdata
- unifi-poller
- varken
- influxdb on macOS
- screens for macOS
👨🏻💻 [configuring influxdb to accept opentsdb]
- 🗣 note: i have influxdb installed on my macOS and did not use the influxdb in my docker, this is for ease of administration and configuration. steps listed here is solely on a brew-installed influxdb. using the docker-influxdb, somehow i couldn’t get netdata to communicate with the opentsdb backend.
launch your terminal.app and edit your influxdb:
nano /usr/local/etc/influxdb.confdo a search for opentsdb using ctrl+w. once you locate that, enable it by uncommenting and amending the following information:
 [[opentsdb]]
     enabled = true
     bind-address = ip.of.your.macOS.influxdb:4242
     database = "opentsdb"
save the file and then restart your influxdb using the brew command:
brew services restart influxdbcreate the opentsdb database in influx. type the following commands in sequence:
 influx
 create database opentsdb
 show databases
- 🗣 note: you should see opentsdb as one of your listed databases.
- that’s the configuration for influxdb.
👨🏻💻 [getting netdata to pipe data into influxdb]
- ssh into you device (synology/macOS) and then locate the netdata.conf file. this file is normally stored in the following directory:
- macOS: /usr/local/etc/netdata/
- synology: /opt/netdata/etc/netdata/
- edit the netdata.conf using nano or vim:
- 🗣 note: using macOS as an example below.
nano /usr/local/etc/netdata/netdata.confinclude the following lines:
 [backend]
             enabled = yes
             type = opentsdb
             destination = tcp:ip.address.of.macOS.influxdb:4242
you will need to do the same for your synology netdata.conf file.
restart netdata:
 killall netdata
 /opt/netdata/bin/netdata
👨🏻💻 [setting up a opentsdb datasource in grafana]
login to your grafana dashboard and add a new datasource.
choose influxdb and add the following:
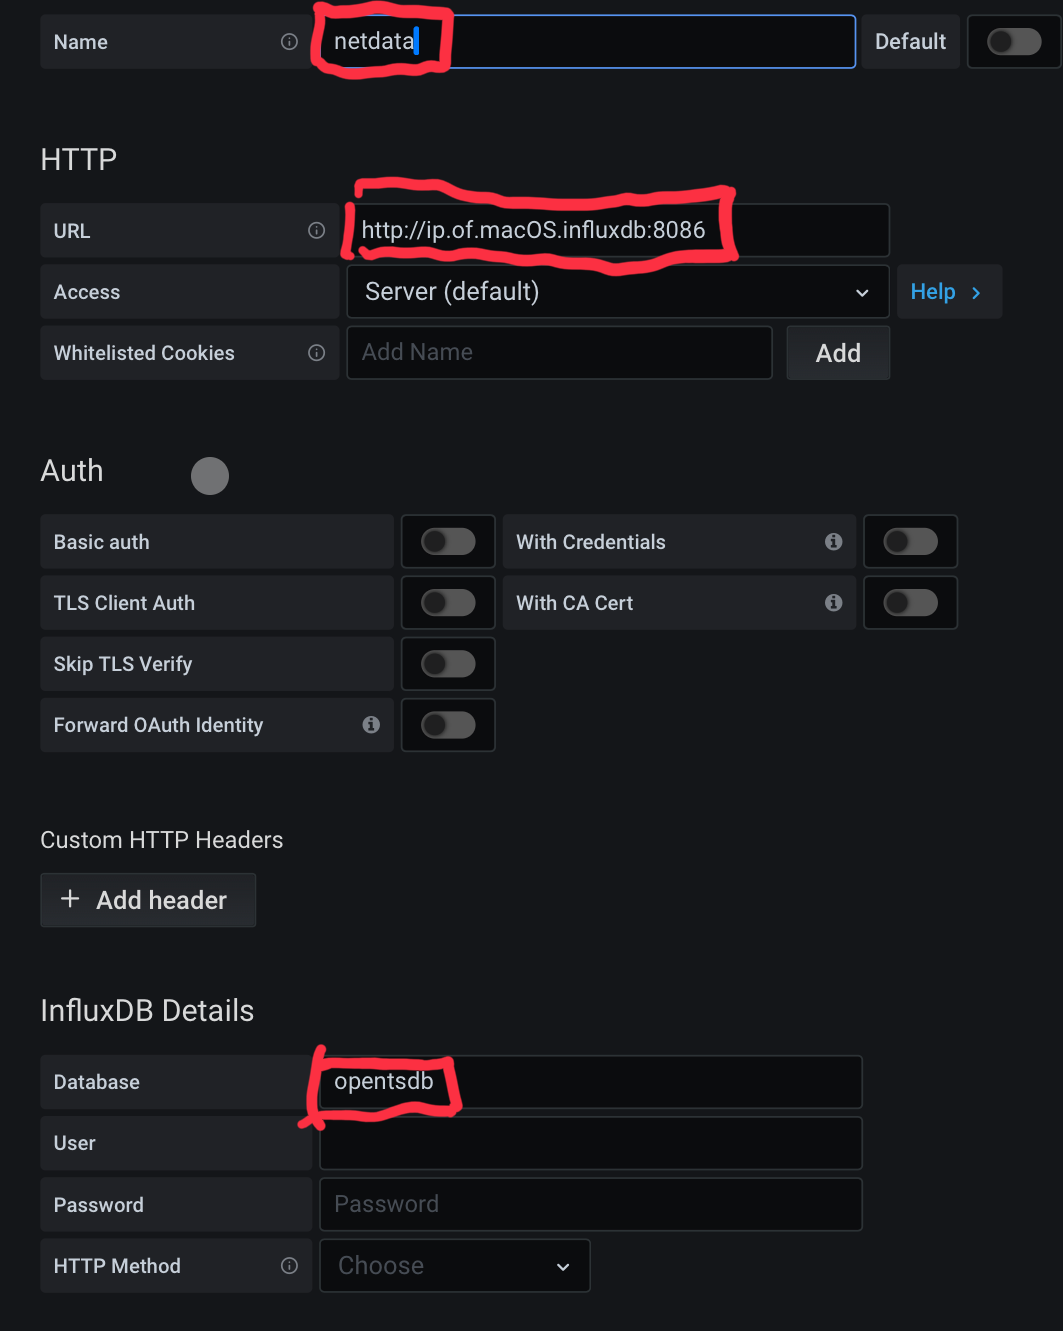
- add the datasource, if you had your influxdb.conf configured correctly, the save and test will produce a successful result.
👨🏻💻 [configuring synologystats.sh]
create the synobox database in influxdb. open a terminal.app and login to your macOS, type the following in sequence:
 influx
 create database synobox
 show databases
- 🗣 note: you should see synobox as one of your listed databases.
- login to your synology dsm and then enable snmp if you have not done so.
- 🗣 note: the default snmp trap name is public. if you changed this, make sure that this is reflected in the script later.
ssh into your synology box and create a folder for the synology script.
mkdir /volume1/synologyscriptcreate the script using nano or vim.
nano /volume1/synologyscript/synologystats.shpaste the following script and ensure that you replace public with your snmp trap name if you changed it. ipaddressofyournas refers to your synology ip and ipaddressofyourmacinfluxdb to your macOS influxdb ip. change numdrives=x to the number of drives that corresponds to the number of drives on your synology
#!/bin/bash
#This script pulls storage information from the Synology NAS

#The time we are going to sleep between readings
#Also used to calculate the current usage on the interface
#30 seconds seems to be ideal, any more frequent and the data
#gets really spikey.  Since we are calculating on total octets
#you will never loose data by setting this to a larger value.
sleeptime=30


get_drive_temps () {
    counter=0
    numdrives=10
    while [  $counter -lt $numdrives ]; do

        #Get Drive Name
        syno_drivename=`snmpwalk -v 2c -c public IPADDRESSOFYOURNAS 1.3.6.1.4.1.6574.2.1.1.2.$counter -Ov | cut -c 10-`
        syno_drivename=${syno_drivename::-1}
        syno_drivename=${syno_drivename// /_}

        #Get Health Status
        syno_healthstatus=`snmpwalk -v 2c -c public IPADDRESSOFYOURNAS 1.3.6.1.4.1.6574.2.1.1.5.$counter -Ov | cut -c 10-`

        #Get Health Status
        syno_drivetemps=`snmpwalk -v 2c -c public IPADDRESSOFYOURNAS 1.3.6.1.4.1.6574.2.1.1.6.$counter -Ov | cut -c 10-`

        echo "Drive Name: $syno_drivename"
        echo "Health Status: $syno_healthstatus"
        echo "Drive Temps: $syno_drivetemps"

        # write to database here
        curl -i -XPOST 'http://IPADDRESSOFYOURMACINFLUXDB:8086/write?db=synobox' --data-binary "storage_data,host=synology,diskname=$syno_drivename disktemperature=$syno_drivetemps"
        curl -i -XPOST 'http://IPADDRESSOFYOURMACINFLUXDB:8086/write?db=synobox' --data-binary "storage_data,host=synology,diskname=$syno_drivename diskstatus=$syno_healthstatus"

        let counter=counter+1
        done
    }

get_syno_temp () {
    COUNTER=0
    while [  $COUNTER -lt 4 ]; do
        #-- Synology NAS --
        #DS Temp
        syno_temperature=`snmpwalk -v 2c -c public IPADDRESSOFYOURNAS 1.3.6.1.4.1.6574.1.2 -Ov | cut -c 10-`

        echo "Synology Temperature: $syno_temperature"


        curl -i -XPOST 'http://IPADDRESSOFYOUMACINFLUXDB:8086/write?db=synobox' --data-binary "syno_temperature,host=synology,temperature=Synology_Temperature value=$syno_temperature"

        let COUNTER=COUNTER+1

    done
}


#Prepare to start the loop and warn the user
echo "Press [CTRL+C] to stop..."
while :
    do
        get_drive_temps
        get_syno_temp

        if [[ $syno_volblocksize -le 0 || $syno_volcapacity -le 0 || $syno_volused -le 0 ]];
then
        echo "Skip this datapoint - something went wrong with the read"
else
        #Output console data for future reference
        print_data
        write_data
fi

    if [[ $syno_temp -le 0 ]];
        then
        echo "Skip this datapoint - something went wrong with the read"
else
        #Output console data for future reference
        print_data
        write_data
fi

    #Sleep between readings
    sleep "$sleeptime"

done
save the file.
you will now need to make the file executable. use the following command:
chmod a+x /volume1/synologyscript/synologystats.shto execute the file, you will need to run it via a ./ command. how i did it was to run it off my mac, via screen. first ssh into your macOS server and type the following:
screennow still in the screen box, ssh into your macOS box.
ssh -l admin synology.iplogin as root using the sudo -i command and then navigate to the synologystats.sh script folder:
cd /volume1/synologyscript/execute the script:
./synologystats.shonce done, on your keyboard, hold on ctrl and press a and d to detach. to bring up the screen again, type screen -r.
👨🏻💻 [setting up synobox datasource in grafana]
login to your grafana dashboard and add a new datasource.
choose influxdb and add the following:
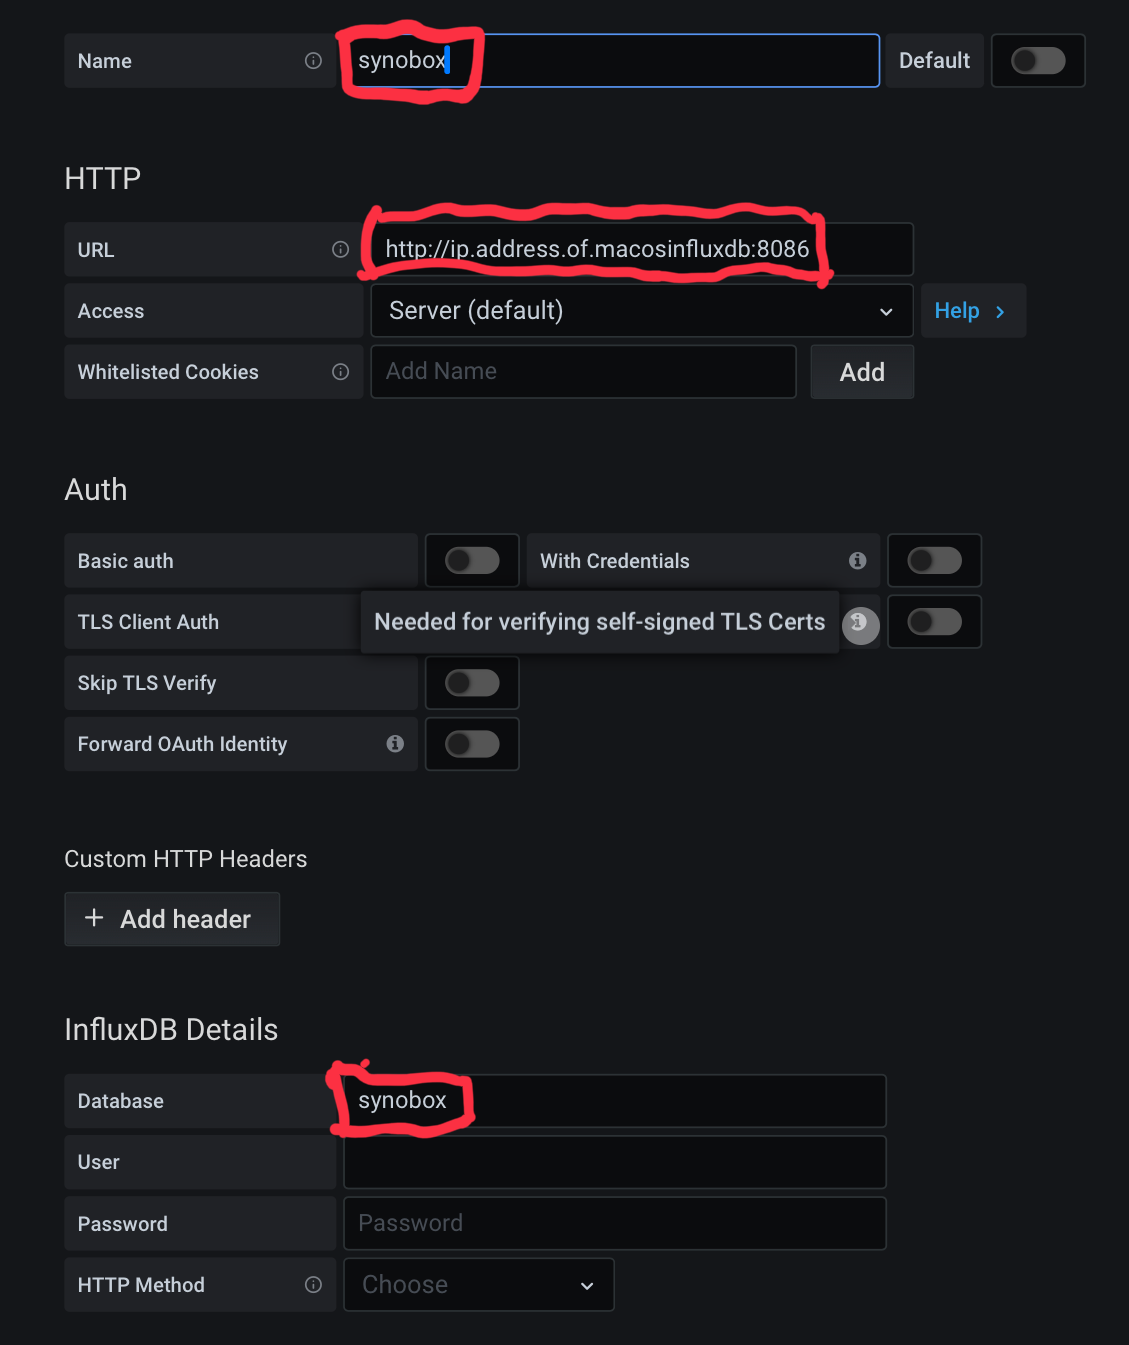
- done
👨🏻💻 [configuring new panels with netdata and synobox and unifipoller]
- login to your grafana dashboard and load your current dashboard. create a copy of your existing dashboard.
- ⚠️ important: in case you fuck-up, you still have your current dashboard 😂
at the top pane, click on add panel, when presented with the new panel, click on + add panel
from the drop down menu, choose the influxdb that you wish to utilise.
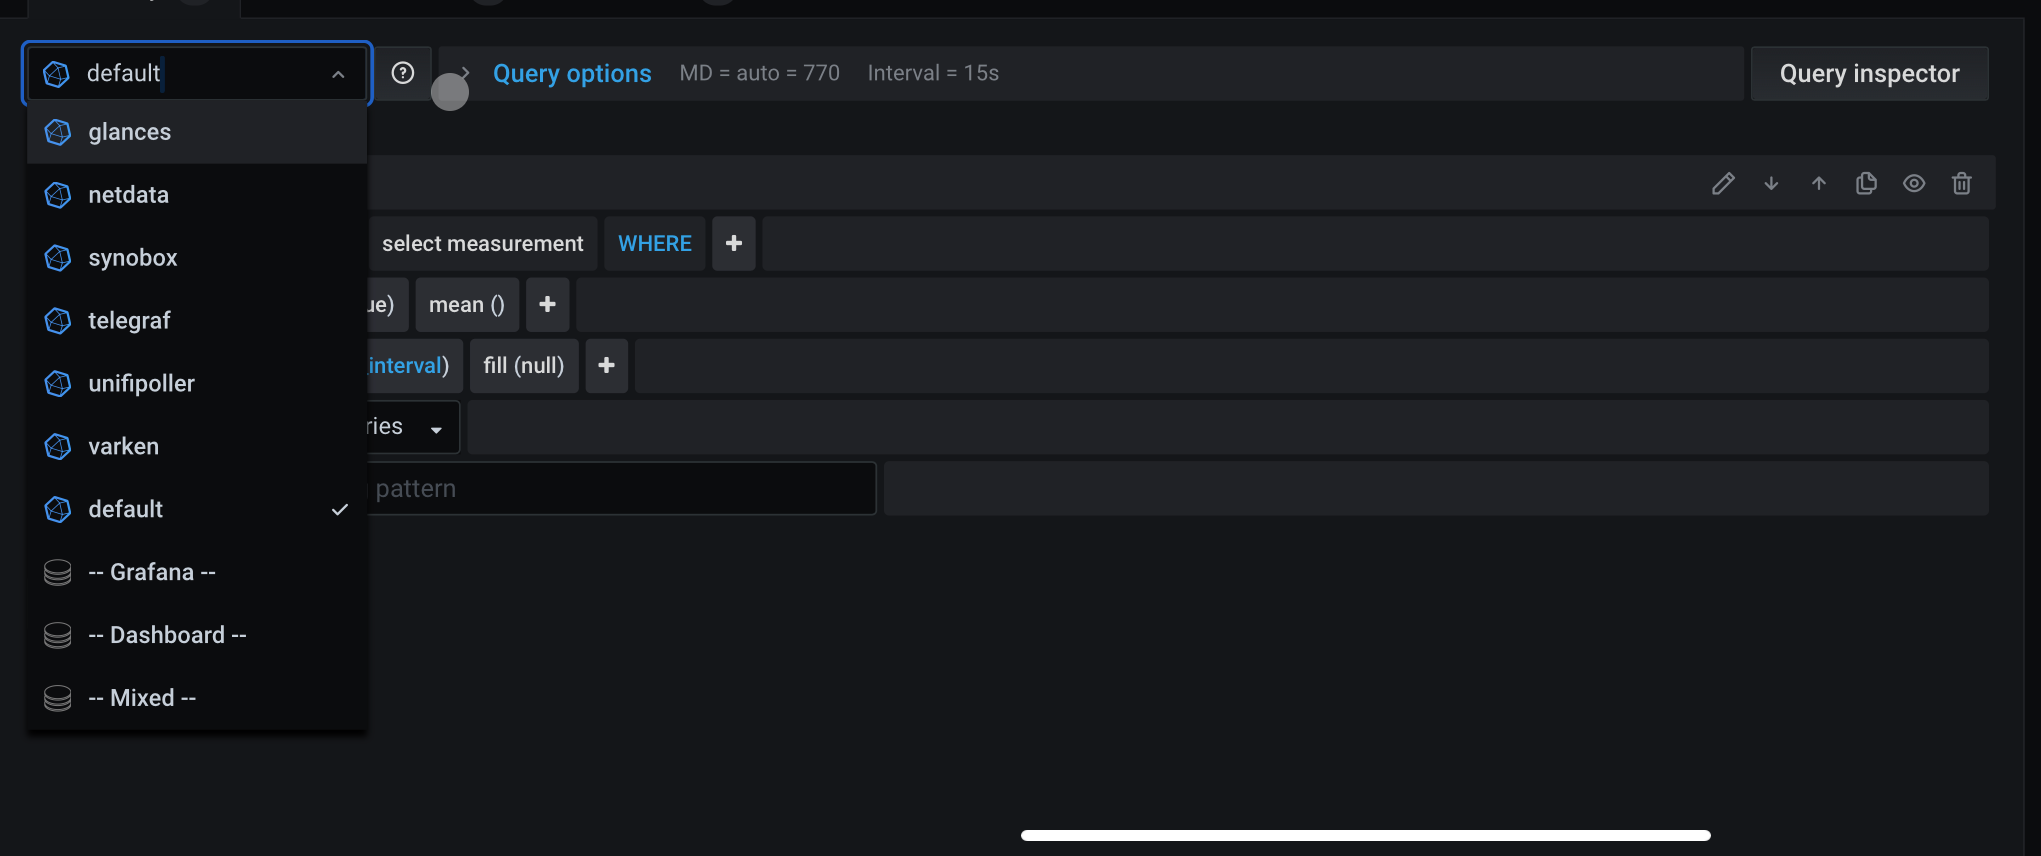
- 🗣 note: if you had done everything correctly, the databases will be there for you to choose. in this example, i will use synobox as a sample.
- choose the information from the queries below to configure what you want to get grafana to display. choose your visualisation, frequency, etc. once done, click on apply and save and your dashboard will be display these new items of your choice.
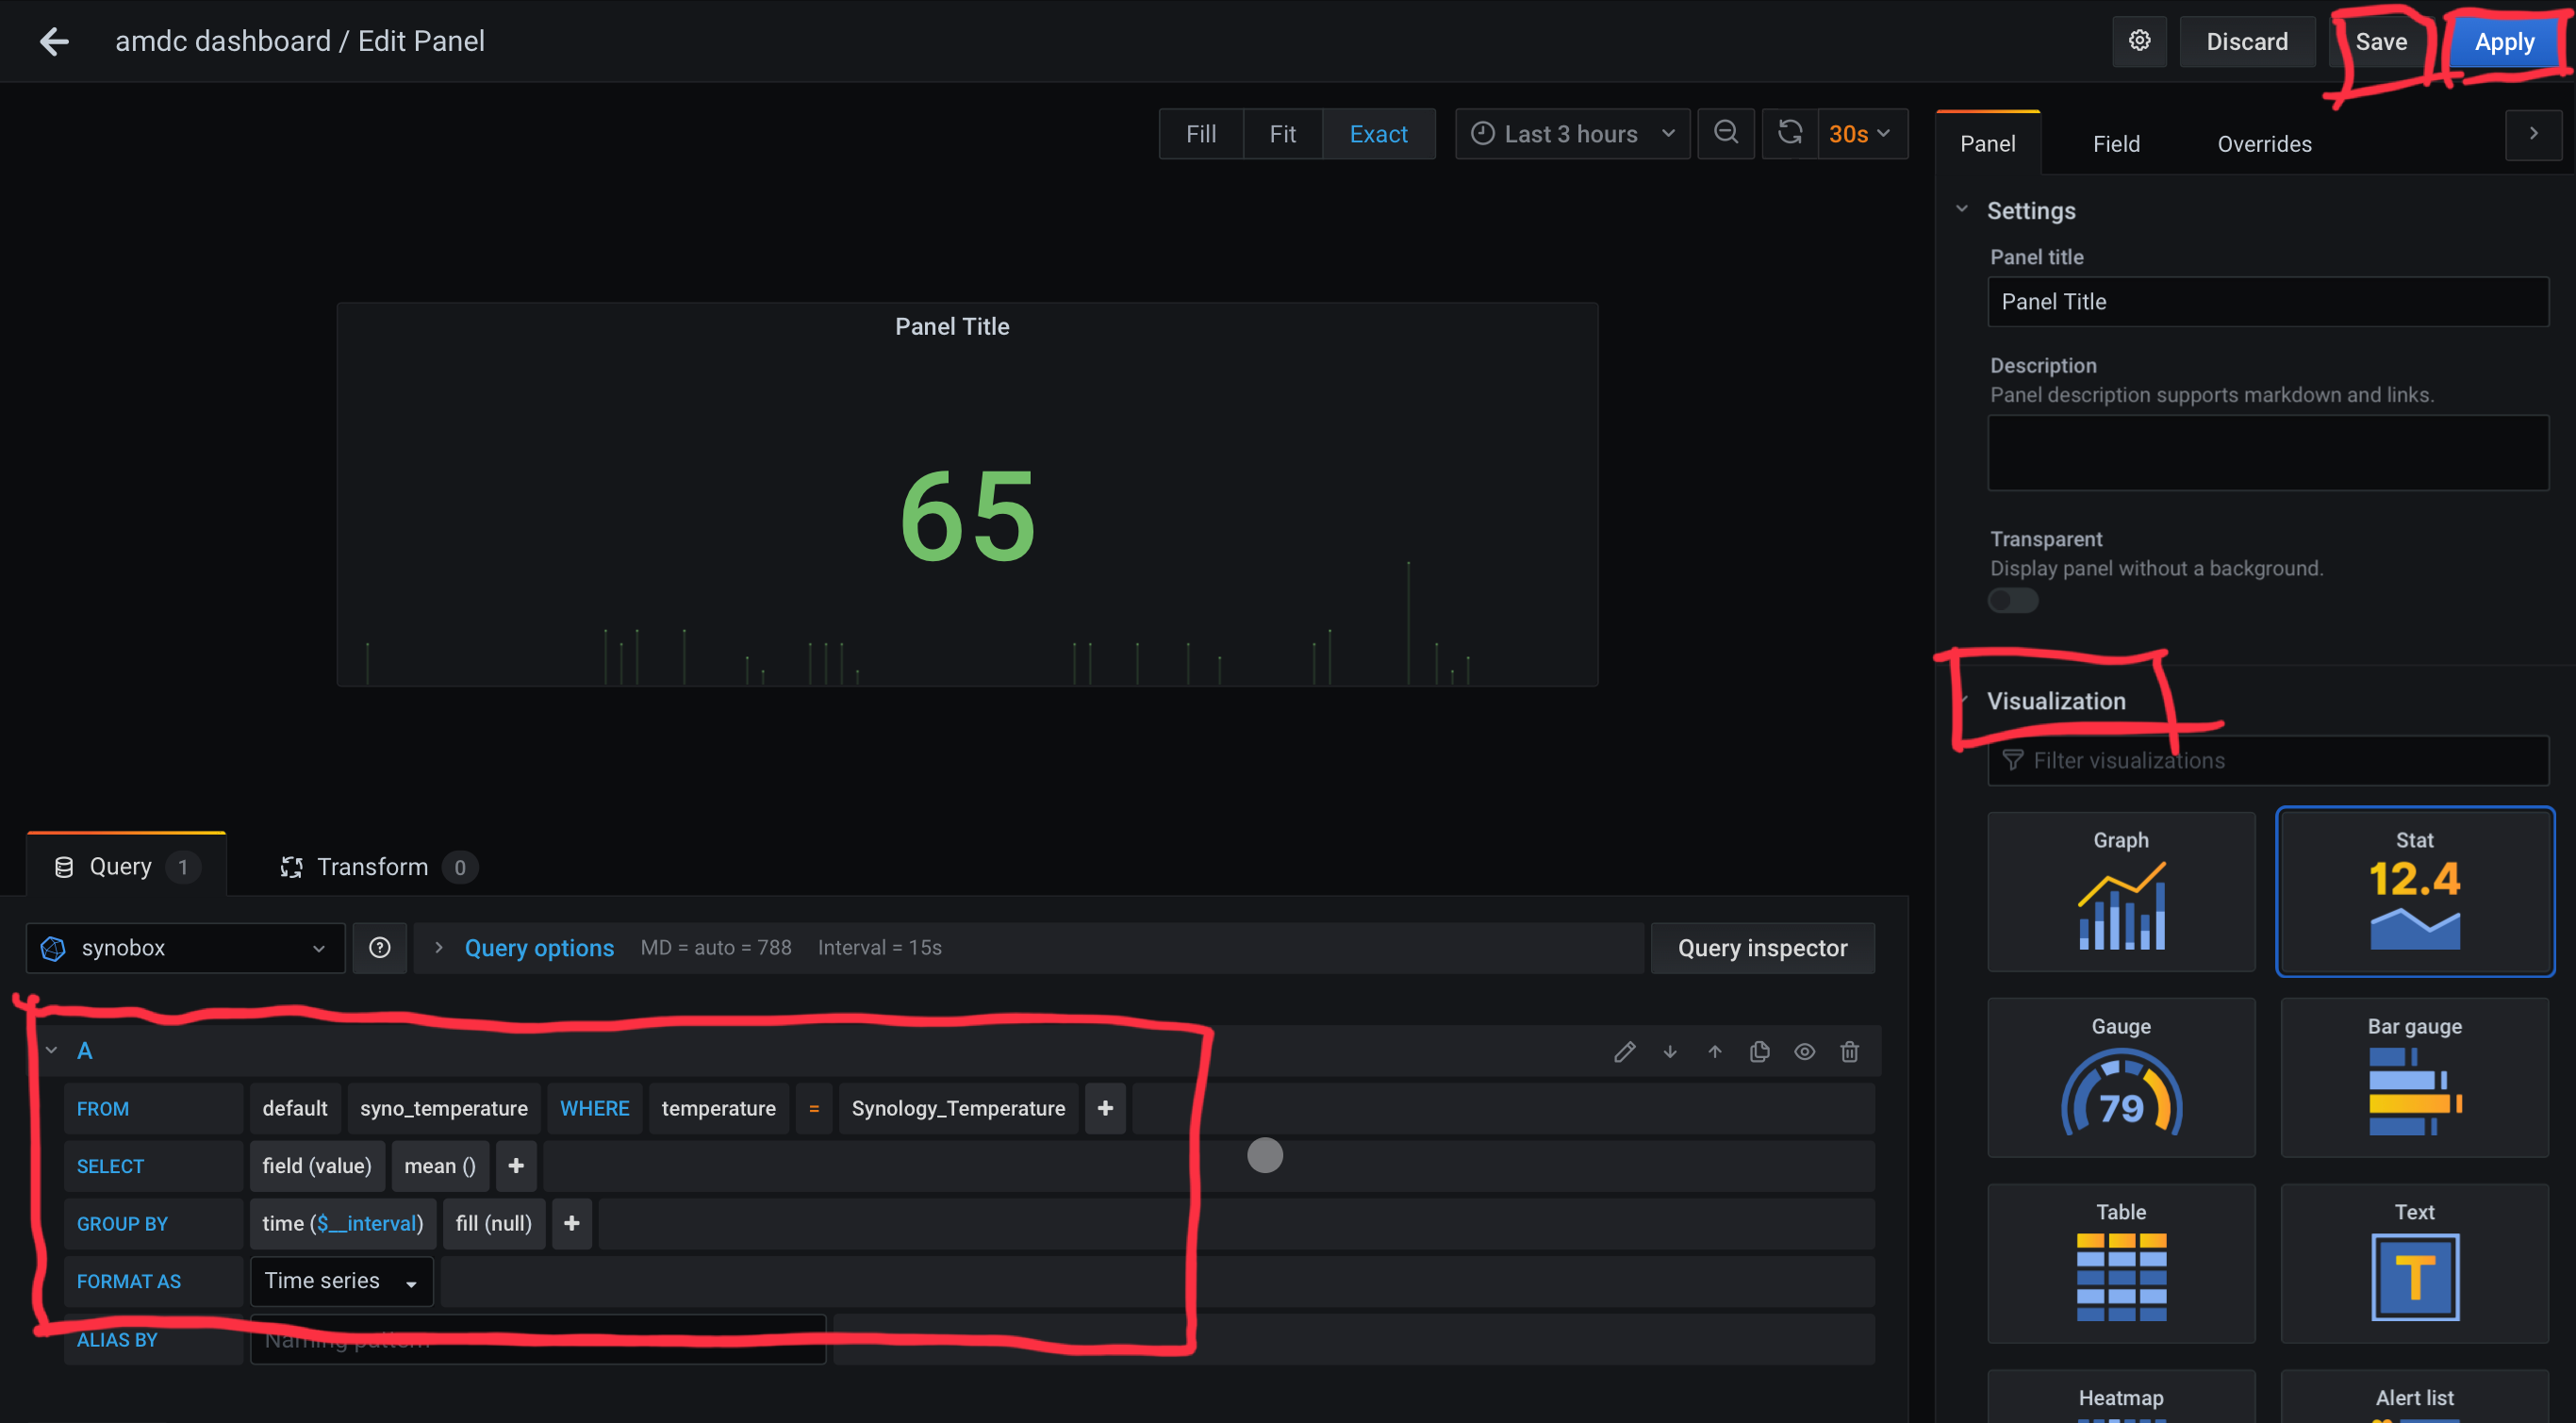
- have fun! 😊
- 🗣 note: there are a ton of options in grafana which displays metrics, measurements, so its good to experiment on the various visualisation methods and panels to use, choose something which suits your taste and also find out how to get these metrics out. sometimes you need to experiment a little to discover what you’re looking for.